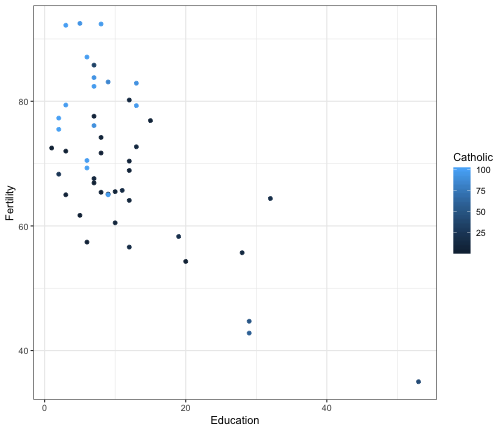
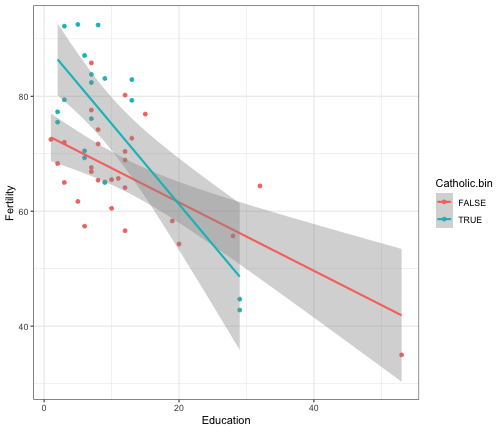
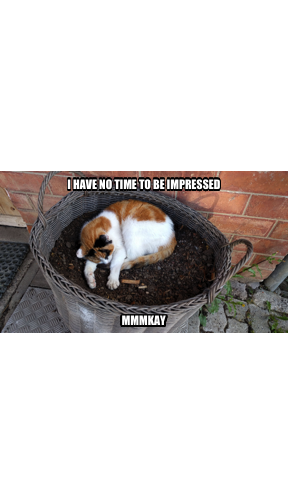
class: center, middle, inverse, title-slide # An introduction to (problem solving with) R ### Sina Rüeger ### 2018-09-12 (updated: 2018-09-13) --- <!-- updated: sys.date()) <!-- From here: https://slides.yihui.name/xaringan/ --> --- layout: true --- class: left, middle # About me - Background in Data Analysis / Data Science - PhD in Life Sciences @ CHUV <i class="ion ion-arrow-right-a "></i> PostDoc @ EPFL (analysis of genetic data) - <i class="fab fa-r-project " style="color:#88398a;"></i>-Ladies Lausanne co-organiser - <i class="ion ion-heart "></i> Data analysis & Genetic data & Data visualisation --- class: center, middle, inverse # What is R? --- class: left, middle # R ... - is "a programming language for statistical computing" - is free - has a webpage: https://www.r-project.org/ - just celebrated its [25 year anniversary](https://rss.onlinelibrary.wiley.com/doi/10.1111/j.1740-9713.2018.01169.x) - comes with *basic*/*default* packages, but there are over 13'000 R-packages 😮 that can be installed through [CRAN](https://cran.r-project.org/web/packages/) or repositories like github --- class: center, middle # Typical data analysis workflow ## 🤔 <i class="fas fa-arrow-right " style="color:gray;"></i> <i class="fas fa-table " style="color:black;"></i> <i class="fas fa-arrow-right " style="color:gray;"></i> <i class="fas fa-laptop " style="color:#377eb8;"></i> <i class="fas fa-arrows-alt " style="color:gray;"></i> <i class="fab fa-r-project " style="color:#377eb8;"></i> <i class="fas fa-arrow-right " style="color:gray;"></i> <i class="fas fa-chart-line " style="color:#f03b20;"></i> <i class="fas fa-arrow-right " style="color:gray;"></i> <i class="fas fa-lightbulb " style="color:#31a354;"></i> <i class="fas fa-arrow-right " style="color:gray;"></i> <i class="fas fa-map-signs " style="color:#d95f0e;"></i> <!--- question > getting data > analysing / distill knowledge > do soemthing with that --> `Question > Data > Analyse data with a tool > Distill knowlege from data > Feel enlightened :-) > Take decisions` --- class: inverse, center, middle # What is R used for? --- class: middle # Quite a few things - In general lots of (but not all) data science, data analysis & stats stuff - Me: genomics, biostatistics - To make presentations (this one) --- ## Basic R ### Math operations ```r 1 + 1 ## basic math operations ``` ``` ## [1] 2 ``` ### Important constants ```r pi ``` ``` ## [1] 3.141593 ``` --- ## Basic R ### Vector, matrices ```r a <- c(34, 1, 67) ## defining a vector mat <- matrix(1:6, ncol = 2) ## defining a matrix class(a) ``` ``` ## [1] "numeric" ``` ```r class(mat) ``` ``` ## [1] "matrix" ``` --- ## Basic R ### Object oriented ```r summary(a) ``` ``` ## Min. 1st Qu. Median Mean 3rd Qu. Max. ## 1.0 17.5 34.0 34.0 50.5 67.0 ``` ```r summary(mat) ``` ``` ## V1 V2 ## Min. :1.0 Min. :4.0 ## 1st Qu.:1.5 1st Qu.:4.5 ## Median :2.0 Median :5.0 ## Mean :2.0 Mean :5.0 ## 3rd Qu.:2.5 3rd Qu.:5.5 ## Max. :3.0 Max. :6.0 ``` --- ## Basic R ### Asking for help ```r `?`(data.frame) ``` ### Making a plot ```r plot(rnorm(100)) ## plot 100 numbers that were drawn randomly from a normal distribution ``` <!-- --> --- ## Statistical analyses ### 1. Load libraries ```r ## install packages (only run this once) install.packages('readr') ## install.packages('dplyr') install.packages('skimr') ## install.packages('ggplot2') library(readr) ## for read_csv() library(dplyr) ## for rename() library(skimr) ## for skim() library(ggplot2) ## for visualisations theme_set(theme_bw()) ``` --- ### 2. Import data ```r dat <- read_csv("https://vincentarelbundock.github.io/Rdatasets/csv/datasets/swiss.csv") # use library(readxl) for xls data! swiss is actually an R package dataset # of library(datasets), but has the column X1 as rownames `?`(swiss) dat ``` ``` ## # A tibble: 47 x 7 ## X1 Fertility Agriculture Examination Education Catholic ## <chr> <dbl> <dbl> <int> <int> <dbl> ## 1 Cour… 80.2 17 15 12 9.96 ## 2 Dele… 83.1 45.1 6 9 84.8 ## 3 Fran… 92.5 39.7 5 5 93.4 ## 4 Mout… 85.8 36.5 12 7 33.8 ## 5 Neuv… 76.9 43.5 17 15 5.16 ## 6 Porr… 76.1 35.3 9 7 90.6 ## 7 Broye 83.8 70.2 16 7 92.8 ## 8 Glane 92.4 67.8 14 8 97.2 ## 9 Gruy… 82.4 53.3 12 7 97.7 ## 10 Sari… 82.9 45.2 16 13 91.4 ## # ... with 37 more rows, and 1 more variable: Infant.Mortality <dbl> ``` --- ### 3. Summarise data ```r ## summary skim(dat %>% select(X1, Fertility, Education, Catholic)) ``` ``` ## Skim summary statistics ## n obs: 47 ## n variables: 4 ## ## ── Variable type:character ────────────────────────────────────────────────────────────────────────────────────────────────────────────────────────────────── ## variable missing complete n min max empty n_unique ## X1 0 47 47 4 12 0 47 ## ## ── Variable type:integer ──────────────────────────────────────────────────────────────────────────────────────────────────────────────────────────────────── ## variable missing complete n mean sd p0 p25 p50 p75 p100 hist ## Education 0 47 47 10.98 9.62 1 6 8 12 53 ▇▇▁▁▂▁▁▁ ## ## ── Variable type:numeric ──────────────────────────────────────────────────────────────────────────────────────────────────────────────────────────────────── ## variable missing complete n mean sd p0 p25 p50 p75 p100 ## Catholic 0 47 47 41.14 41.7 2.15 5.2 15.14 93.12 100 ## Fertility 0 47 47 70.14 12.49 35 64.7 70.4 78.45 92.5 ## hist ## ▇▂▁▁▁▁▁▅ ## ▁▁▁▂▇▅▃▂ ``` --- ### 4. Rename a column ```r ## colum to rownames + binary catholic (> 50%) dat <- dat %>% rename(Region = X1) %>% mutate(Catholic.bin = Catholic > 50) dat ``` ``` ## # A tibble: 47 x 8 ## Region Fertility Agriculture Examination Education Catholic ## <chr> <dbl> <dbl> <int> <int> <dbl> ## 1 Court… 80.2 17 15 12 9.96 ## 2 Delem… 83.1 45.1 6 9 84.8 ## 3 Franc… 92.5 39.7 5 5 93.4 ## 4 Mouti… 85.8 36.5 12 7 33.8 ## 5 Neuve… 76.9 43.5 17 15 5.16 ## 6 Porre… 76.1 35.3 9 7 90.6 ## 7 Broye 83.8 70.2 16 7 92.8 ## 8 Glane 92.4 67.8 14 8 97.2 ## 9 Gruye… 82.4 53.3 12 7 97.7 ## 10 Sarine 82.9 45.2 16 13 91.4 ## # ... with 37 more rows, and 2 more variables: Infant.Mortality <dbl>, ## # Catholic.bin <lgl> ``` --- ### 5. Visualise data ```r ggplot(data = dat) + geom_point(aes(Education, Fertility, color = Catholic)) ``` <!-- --> --- ### 7. Fit model ```r mod <- lm(Fertility ~ Education + Catholic.bin, data = dat) summary(mod) ``` ``` ## ## Call: ## lm(formula = Fertility ~ Education + Catholic.bin, data = dat) ## ## Residuals: ## Min 1Q Median 3Q Max ## -17.739 -5.832 -1.953 6.251 15.466 ## ## Coefficients: ## Estimate Std. Error t value Pr(>|t|) ## (Intercept) 75.9378 2.3091 32.886 < 2e-16 *** ## Education -0.8006 0.1355 -5.909 4.59e-07 *** ## Catholic.binTRUE 7.8173 2.6512 2.949 0.0051 ** ## --- ## Signif. codes: 0 '***' 0.001 '**' 0.01 '*' 0.05 '.' 0.1 ' ' 1 ## ## Residual standard error: 8.729 on 44 degrees of freedom ## Multiple R-squared: 0.5329, Adjusted R-squared: 0.5117 ## F-statistic: 25.1 on 2 and 44 DF, p-value: 5.332e-08 ``` --- ### 7. Linear regression on plot ```r ggplot(data = dat, aes(Education, Fertility, color = Catholic.bin, group = Catholic.bin)) + geom_point() + geom_smooth(method = "lm") ``` <!-- --> --- ## Data journalism <a href="https://www.srf.ch/static/srf-data/data/2018/federer/#/en"> <img border="0" alt="SRF" src="img/datajournalism.png" width="800"> </a> [Source: SRF](https://www.srf.ch/static/srf-data/data/2018/federer/#/en) --- ## Data journalism <a href="https://srfdata.github.io/2018-01-roger-federer/#load_data"> <img border="0" alt="SRF" src="img/datajournalism_code.png" width="800"> </a> [Source: SRF](https://srfdata.github.io/2018-01-roger-federer/) --- ## Memes and GIFs <a href="http://djnavarro.net/post/2018-05-03-valid-social-commentary/"> <img src="http://djnavarro.net/post/2018-05-03-valid-social-commentary_files/figure-html/unnamed-chunk-2-1.png" width="600"> </a> [Source: Danielle Navaro](http://djnavarro.net/post/2018-05-03-valid-social-commentary/) --- ## Memes and GIFs ```r ## install.packages('glue') ## run this once install.packages('meme') ## run ## this once library(meme) ## tell R that the meme package is needed library(glue) ## tell R that the glue package is needed loc <- "https://djnavarro.net/img/meme/" ``` ```r meme(img = glue(loc, "morpheus.png"), upper = "what if i told you", lower = "i made this in R", size = 1) ``` [Source: Danielle Navaro](http://djnavarro.net/post/2018-05-03-valid-social-commentary/) --- ## Memes and GIFs ```r meme(img = "img/cat.jpeg", upper = "I have no time to be impressed", lower = "MMMkay", size = 1) ``` <!-- --> --- ## Animations <blockquote class="twitter-tweet" data-cards="hidden" data-lang="en"><p lang="en" dir="ltr">Getting ready to teach dplyr joins to new <a href="https://twitter.com/hashtag/rstats?src=hash&ref_src=twsrc%5Etfw">#rstats</a> users tomorrow, so naturally I productively procrastinated by getting to know the new gganimate. It is the coolest! <a href="https://t.co/1kkOi5D5TK">pic.twitter.com/1kkOi5D5TK</a></p>— Garrick Aden-Buie (@grrrck) <a href="https://twitter.com/grrrck/status/1029567123029467136?ref_src=twsrc%5Etfw">August 15, 2018</a></blockquote> <script async src="https://platform.twitter.com/widgets.js" charset="utf-8"></script> --- ## Animations <a href="https://raw.githubusercontent.com/gadenbuie/tidy-animated-verbs/master/images/anti-join.gif"> <img src="https://raw.githubusercontent.com/gadenbuie/tidy-animated-verbs/master/images/anti-join.gif" width="400"> </a> [Source: Github](https://github.com/gadenbuie/tidy-animated-verbs#tidy-animated-verbs) --- ## Decision making for lunch <blockquote class="twitter-tweet" data-lang="en"><p lang="en" dir="ltr">Just learned, courtesy of <a href="https://twitter.com/AdamGruer?ref_src=twsrc%5Etfw">@AdamGruer</a>, that there is an <a href="https://twitter.com/hashtag/rstats?src=hash&ref_src=twsrc%5Etfw">#rstats</a> compiler app on iOS. What people may not know is that for years I have been using 'sample' function in R to make decisions for difficult choices. Now I have it handy in my mobile!<br> <a href="https://t.co/vQxVNhjchm">https://t.co/vQxVNhjchm</a> <a href="https://t.co/rCPubC6BeD">pic.twitter.com/rCPubC6BeD</a></p>— Emi Tanaka 🌾 (@statsgen) <a href="https://twitter.com/statsgen/status/1027332304656465920?ref_src=twsrc%5Etfw">August 8, 2018</a></blockquote> <script async src="https://platform.twitter.com/widgets.js" charset="utf-8"></script> --- class: inverse, center, middle # How can I use it? --- class: left, middle ## Getting started 1. **Install** R : - On a computer: via [RStudio](https://www.rstudio.com/products/rstudio/download/) or [R project](https://stat.ethz.ch/CRAN/). - Or (easier) use R in browser: [rdrr.io/snippets/](https://rdrr.io/snippets/) (no login required) or [Studio Cloud](https://rstudio.cloud/) (login with google or githu baccount). -- 1. ⁉️ Come up with a **question** you want to answer. -- 1. Get your hands on **data** 🔀 Take part in [TidyTuesday](https://github.com/rfordatascience/tidytuesday). --- class: inverse, center, middle # R Community --- class: center, middle ## <i class="fas fa-rocket " style="color:black;"></i> R is developing quickly <i class="fas fa-rocket " style="color:black;"></i> ## <i class="fas fa-users " style="color:black;"></i> R community can help you learn! --- class: left, middle ## [RWeekly](https://rweekly.org/) Newsletter <i class="fas fa-dove " style="color:black;"></i> <i class="fas fa-envelope " style="color:black;"></i> - Submit & subscribe here: https://rweekly.org/ - Weekly selection of **blogs** delivered into your mailbox. - Replicating code is a good way to learn! --- class: left, middle ## [TidyTuesday](https://github.com/rfordatascience/tidytuesday) TidyTuesday provides you weekly with a new dataset (and a goal). <blockquote class="twitter-tweet" data-lang="en"><p lang="en" dir="ltr">The <a href="https://twitter.com/R4DScommunity?ref_src=twsrc%5Etfw">@R4DScommunity</a> welcomes you to week 19 of <a href="https://twitter.com/hashtag/tidytuesday?src=hash&ref_src=twsrc%5Etfw">#tidytuesday</a>! We're exploring <a href="https://twitter.com/FiveThirtyEight?ref_src=twsrc%5Etfw">@FiveThirtyEight</a> data on airline safety! Many thanks to 538 package maintainers!<br><br>Data: <a href="https://t.co/sElb4fcv3u">https://t.co/sElb4fcv3u</a> <br>Article: <a href="https://t.co/qmm69g8khc">https://t.co/qmm69g8khc</a> <a href="https://twitter.com/hashtag/r4ds?src=hash&ref_src=twsrc%5Etfw">#r4ds</a> <a href="https://twitter.com/hashtag/tidyverse?src=hash&ref_src=twsrc%5Etfw">#tidyverse</a> <a href="https://twitter.com/hashtag/rstats?src=hash&ref_src=twsrc%5Etfw">#rstats</a> <a href="https://twitter.com/hashtag/dataviz?src=hash&ref_src=twsrc%5Etfw">#dataviz</a> <a href="https://t.co/wl5UZCojEP">pic.twitter.com/wl5UZCojEP</a></p>— Thomas @ Strata Data NY - RStudio Booth (@thomas_mock) <a href="https://twitter.com/thomas_mock/status/1026505945722101760?ref_src=twsrc%5Etfw">August 6, 2018</a></blockquote> <script async src="https://platform.twitter.com/widgets.js" charset="utf-8"></script> --- class: left, middle ## TidyTuesday .pull-left[ ### Dataset <a href="https://github.com/rfordatascience/tidytuesday/blob/master/data/2018-08-07/week19_airline_safety.csv"> <img src="img/airline_data.png" width="400"> </a> ] .pull-right[ ### Goal (if you need one) <a href="https://fivethirtyeight.com/features/should-travelers-avoid-flying-airlines-that-have-had-crashes-in-the-past/"> <img src="img/airline_publication.png" width="300"> </a> ] --- class: left, middle ## <i class="fab fa-r-project " style="color:#88398a;"></i>-Ladies <img src="https://raw.githubusercontent.com/rladies/starter-kit/master/stickers/hex-logo-with-text.png" width="200"> - **Global** organisation. - **Mission**: *To increase gender diversity in the R community* by encouraging, inspiring, and empowering underrepresented minorities. - Founded in 2012 by [**Gabriela de Queiroz**](https://rladies.org/united-states-rladies/name/gabriela-de-queiroz/). - Currently **125 R-Ladies meetup groups** in 40 countries. --- class: center, middle <img src="https://raw.githubusercontent.com/rladies/Map-RLadies-Growing/master/rladies_growth.gif"> .footnote[[Source code](https://github.com/rladies/Map-RLadies-Growing) by [Daniela Vázquez](https://twitter.com/d4tagirl).] --- class: left, middle <img src="https://raw.githubusercontent.com/rladies/starter-kit/master/stickers/hex-logo-with-text.png" width="300"> - Find our more about **R-Ladies**: https://rladies.org/ - Find other **chapters**: https://gqueiroz.shinyapps.io/rshinylady/ - Find **speakers**: https://rladies.org/directory/ --- class: left, middle ## R user groups nearby <i class="fas fa-users " style="color:black;"></i> - R-Ladies chapter in Lausanne: https://www.meetup.com/rladies-lausanne/ - Geneve R user group: https://www.meetup.com/Geneve-R-User-Group/ - R Lunches in Geneve: http://use-r-carlvogt.github.io/prochains-lunchs/ - adminR in Bern: https://www.meetup.com/adminR/ - Check out global list [here](https://jumpingrivers.github.io/meetingsR/) (provided by jumping rivers) --- class: left, middle ## Keeping up on the road: Podcasts <i class="fas fa-headphones " style="color:black;"></i> - [Not So Standard Deviations](https://soundcloud.com/nssd-podcast) by Hilary Parker and Roger Peng. Data science podcast. - [Credibly Curious](https://soundcloud.com/crediblycurious) by Saskia Freytag and Nicholas Tierney. A podcast about R and statistics. - [DataCamp Podcast](https://www.datacamp.com/community/podcast) explores different data science jobs. It's not always, but often about R. --- class: inverse, center, middle # Thank you! Slides: [https://sinarueeger.github.io/20180912-geek-girls-carrots/slides#1](https://sinarueeger.github.io/20180912-geek-girls-carrots/slides#1) Source code: [https://github.com/sinarueeger/20180912-geek-girls-carrots/](https://github.com/sinarueeger/20180912-geek-girls-carrots/) <i class="fab fa-twitter " style="color:white;"></i>: [@sinarueeger](https://twitter.com/sinarueeger)