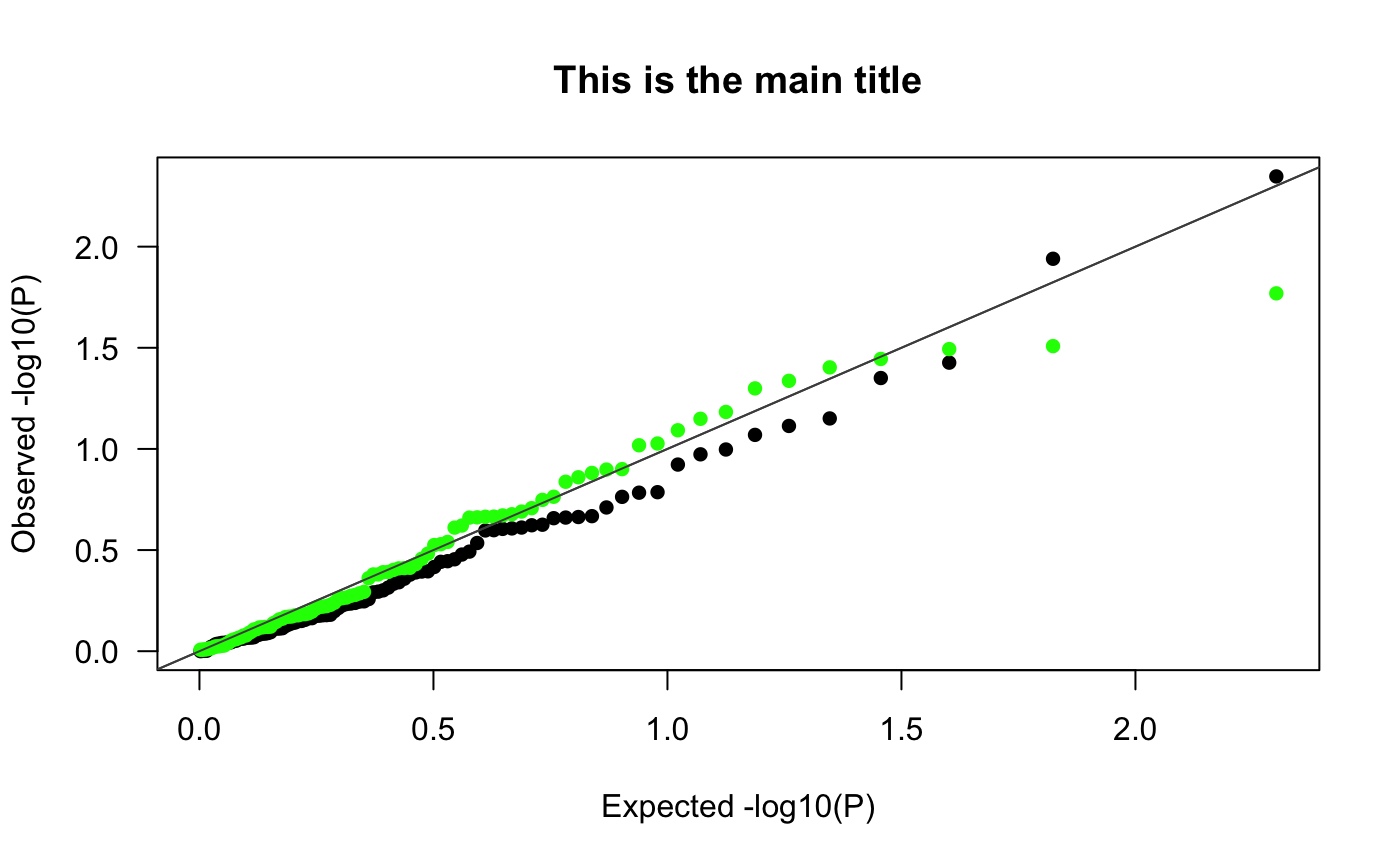
Creates a QQplot, given P-values, which should be uniformly distributed
QQplot(p, neff = NULL, main = "QQplot", col = "black", add = FALSE,
  ...)
Arguments
| p | numeric vector, values between 0 and 1. |
|---|---|
| neff | number of effective tests. see function |
| main | Main title |
| col | color code |
| add | logic, added to plot or not |
| ... | pass plot arguments on |
Value
plot (base)
See also
https://github.com/sinarueeger/ggGWAS (in development) and qq