Chapter 2 Introduction to R
As developers, “tidyevaluations” help us make sure the users do as little typing as possible and can express really rich ideas [for analysis]. This is what underlies ggplot2 and some of our other libraries (Editor’s note: ggplot2 is a popular data visualization library.) The idea is to get things out of your head and on to the computer as quickly as possible.
Hadley Wickham, in a recent Quartz interview.
The R Project for Statistical Computing - or simply R - was developed for statistical data analysis 25 years ago.
It is free software and anyone can contribute to the software by creating a package1.
R comes with default packages, but there are over 13’000 R-packages that can be installed through CRAN or repositories like Github.
While R was developed to do mainly statistical computations (e.g. regression models) and data visualisation, it has a lot of additional features that support the data analysis workflow, but could stand on its own too (e.g. blogdown or magick).
2.1 Features of R
At its core, R is a calculator and able to estimate statistical models. Because we can write scripts, R can help us to organise the data analysis workflow better.
R is used for a lot for data science, data analysis and statistics in both academia and industry.
There are at least three features that make R ideal for data analysis:
- Communication of results through
Data visualisation with
ggplot2- Accessing tools outside R (via APIs, application programming interface)
2.2 Functions, objects, packages and scripts
Four terms will often be mentioned: functions, objects, packages and scripts.
A function is a pre-written chunk of code that contains a list of commands to be executed, similar to a mathematical function3. For example, the mean is a function in R that takes a sequence of numbers as input, like so: mean(1:15). Typically, functions have an input and an output, but they do not have to.
In R you can either use functions written by others, or create you own one, if you want to recycle a code chunk.
How many functions can you spot in the following example?
set.seed(3)
x <- rnorm(n = 10)
mean(x)
set.seed is a function that takes a number as input and makes sure that the random number generation used for rnorm() is reproducible4. rnorm() needs at least the number of normally distributed random numbers as input. mean() takes what is called a vector. n is called an argument of a function. Some arguments have default values and don’t need to be provided necessarily. If you type ?rnorm you will see that the default mean and standard deviation are set to mean = 0 and sd = 1. But if no value for n is provided, e.g. rnorm(mean = 20), R will return an error message.
In this example, the 10 random numbers are stored as an object x. The mean function applies an action to that object. Thus another way of thinking of functions and objects is, to think of them as a verb and a noun. Many of a new generation of functions are verbs; applying the function filter() to a dataset returns a subset of rows. In this case, filter is the verb, and the dataset is the noun.
If such functions and objects are chained, as in the random number generation above, this is called a programming script when stored as a text file. Scripts allow the repetition of a computation. If we think back to the data analysis workflow, then each of the steps - import, tidying, transform, model, dataviz & communication - could be stored as a script and executed sequentially.
The last term is a package or library5. A package is a collection of functions. Any function in R comes from a package and needs to be called. There is a handful of default packages whose functions do not need to be called explicitly, such as mean() or matrix(). But the rest needs to have a statement before executing the function.
The following example creates a histogram, but to tell R that qplot comes from the ggplot2, we first need to make the library(ggplot2) statement:
library(ggplot2)
set.seed(3)
x <- rnorm(n = 1000)
qplot(x)
Anyone can contribute a package to R. That can be a new statistical method or any chunk of code that a user would like to make available to other R users.
2.3 R vs. RStudio
We will briefly look at the difference between R and RStudio. R is the language and RStudio an IDE (integrated development environment) for R.
The default R program looks like this: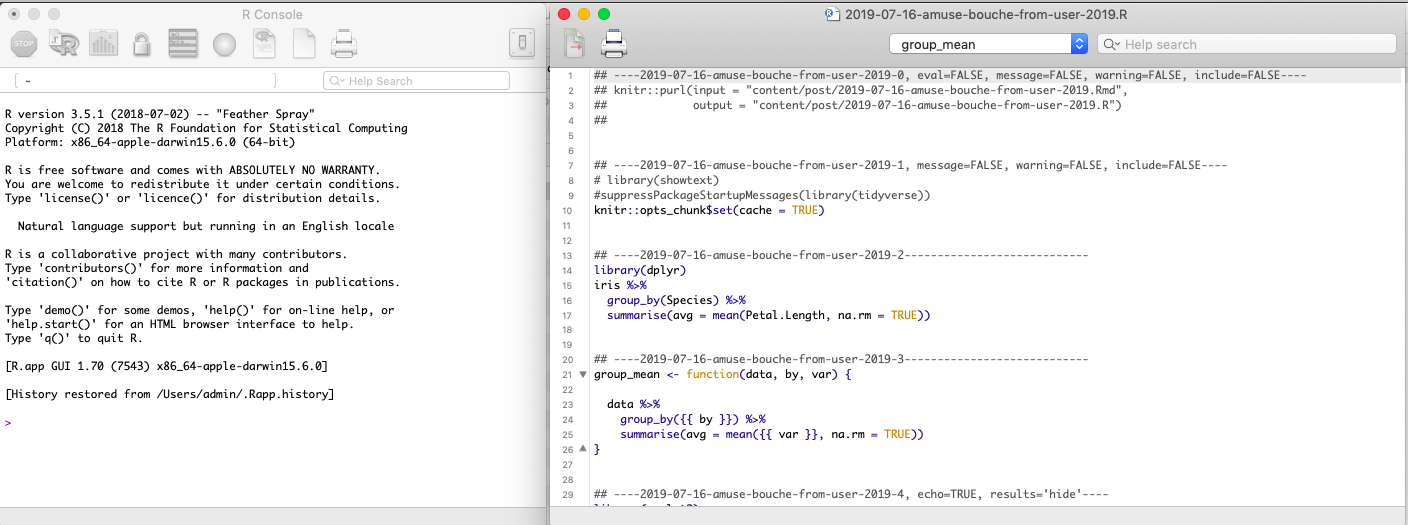
Screenshot of default R
R can be run without any IDE, but having one makes writing scripts easier (extra tools, visually appealing, customisable, interactive). RStudio is a company but provides a free version for individual users.
If you have used an IDE before, you might be familiar with the structure of the RStudio display, otherwise, check out this tweet: Where are things in RStudio?.
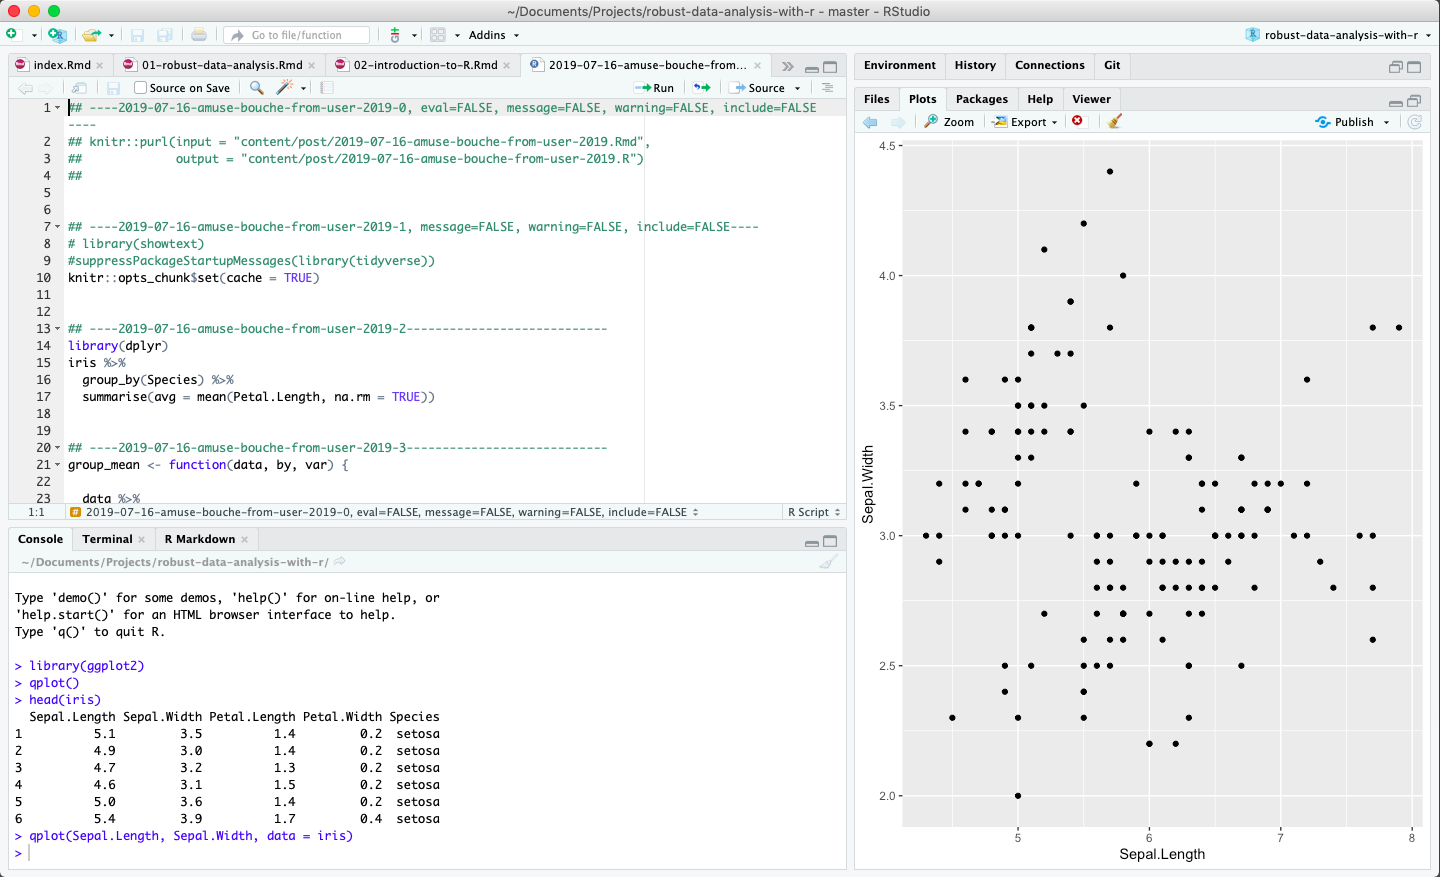
Screenshot of RStudio
2.4 Programming language vs natural language
You can think of R like a very precise natural language specialised in data analysis. For the computer to understand what it should do, it needs precise commands. Once you are used to these commands, you can read R scripts like method sections of papers. Because of this, R scripts not only allow you to communicate with the computer but also colleagues can understand your work.
2.5 More
- Some history of R
- Download R (pick your country)
- Download RStudio
- Instructions on how to install R and RStudio
Function = blocks of pre-written code.↩
See also these resouces (h/t Sharla Gelfand)↩
If you execute lines 1 to 3 several times, the result stays the same. If you execute only lines 2 and 3 several times, the result will change with each execution.↩
There is a difference between the two, but for now, think of them as interchangeable.↩