Recently, I started to seriously1 think about the tidiness of data analysis project folders and the implications of tidying up.
I was lucky enough to talk about what I have figured out so far at the Genève R User Group. While I am not done yet with reflecting on this2, I wanted to write down my thoughts that lead to my presentation3. So what follows is just “thinking out loud”.
Update: In February 2019, Amanda Dobbyn gave a talk at R-Ladies NYC about drake. All material here.
What is a “project folder”?
To me, a project folder is anything that contains the (R-)scripts necessary to run a data analysis and create the corresponding report. It is like a framed piece of work that you can take and place somewhere else. And probably it will take the form of the Figure from the R4DS book below:
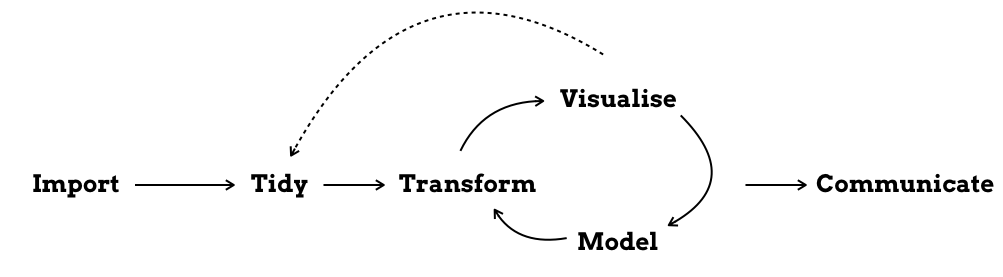
Ideally, you should be able to take that folder as it is, run it on another computer and get the same results. Unfortunately, this is not always the case - at least with my project folders.
I think that the tidiness of a project folder, how it is structured and how it tells the user to execute what and when, correlate strongly with the whole repeatability, replicability and reproducibility aspect.
Why now?
The reason I started to dig deeper into workflow management possibilities in R, is, that I was changing jobs, and I had to clean up my old project folders from almost five years of analysing genetic data 😱. And so I faced this gigantic mess a bit of a mess, spread over several servers and computers, some version controlled, others not, with implemented “best practices” from different waves of trying to improve. I tried to clean up as good as I could, but I told myself that this would not happen again. At my new job, I would use version control for everything, and I would use something make-like (e.g. remake) to indicate the “recipe” of a project and be in control of what is recomputed and what is not4.
Why we tidy up: authority and incentive
I have a long-time interest in tidiness in general, and from studying my behaviour I came up with the theory that tidiness is only present when a) somebody tells you to do it, or b) you are rewarded for it.
Here are some examples:
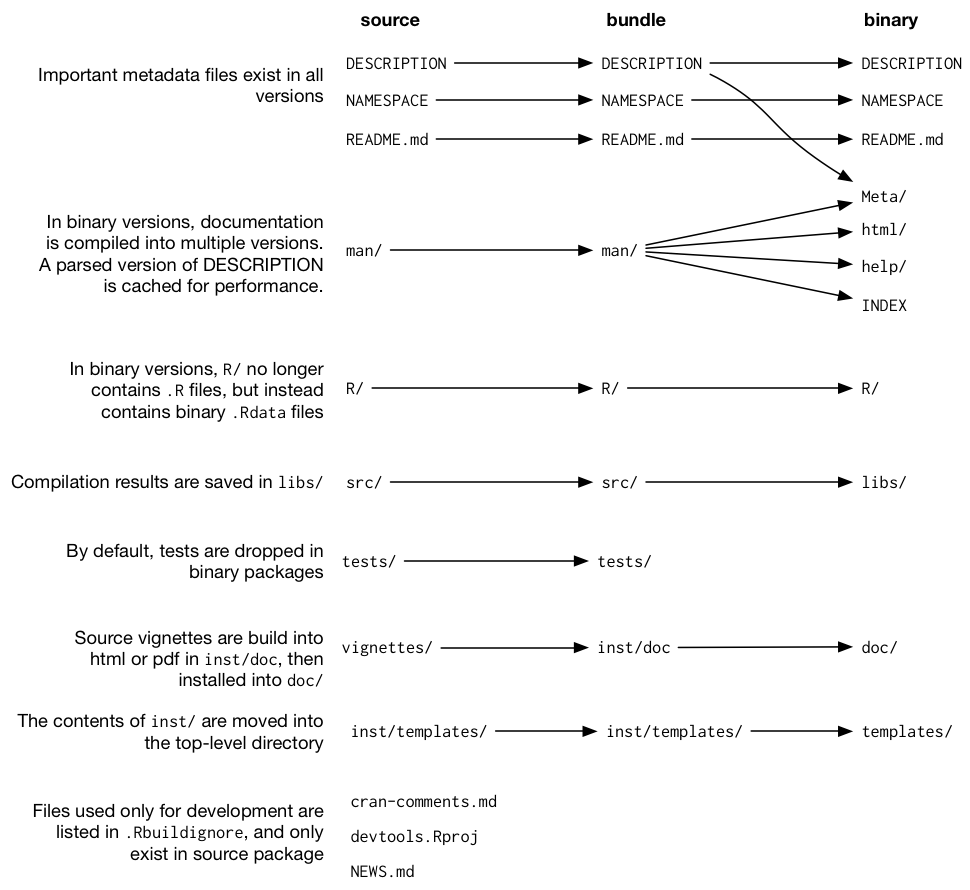
- If you want to compile an R-package you have little to no freedom in how to name folders. You must have a given folder and file structure. Otherwise, it won’t compile. This dictated and unified folder structure makes it easy for R users to understand what is where in an R-package. No matter who coded it.
If you work on several different projects at the same time, it is beneficial to have structure, so that you can quickly dive back into a project.
Following good practices also leaves you more time to do the fun stuff, like modelling and creating data visualisation.
Challenges
I started by wondering why maintaining a tidy and coherent folder structure was so difficult for me to maintain. So I came up with a list (which is undoubtedly going to change over time):
- Having different places for computation (Laptop, Server1, Server2, …).
- Not using
gitconsistently. - Unclear separation of the folders
data(raw input data),processed-dataandoutput-data(results). - Data deliveries: data hardly ever arrives in one tidy folder, but instead comes at different time points and so poses other challenges.
- Having many different best practices implemented: so each project would have its own set of folder names and file naming convention, leading to little overview of the analysis and its iteration steps → cleaning, modelling, visualisation, reports.
- Using similar code in many different R scripts → redundant code.
- Having no punishment for not cleaning up (and also not seeing the benefit).
What I want
Then I asked myself what I want to achieve with implementing (and sticking to) something new.
- Making it easy for colleagues at work to rerun (and understand) the project → “repeatability”
- Making it easy for others to rerun and to understand the project → “reproducibility”5
- Making it easy for others to rerun the code with different data → “replicability”
Next, I looked for solutions. First, I would need to use coherent folder names. Second, I would need to have a file that indicates the recipe of an analysis. Third, I would implement most free floating and redundant code into functions. Fourth, I would minimise unnecessary computation by caching results. Fifth, I would start using unit tests6.
The options
There are many different ready-to-use software packages out there. I was thinking of going back to using make, that I used years ago. Then I came across {remake}, which seemed just what I needed. A colleague at work was using stu and was recommending it. But then the Swiss Institute of Bioinformatics offered a course on Make-like declarative workflows with R taught by Kirill Müller, which I could not attend. Luckily, thanks to the excellent online course material, I could learn it by myself.
Drake
The presentation Make-like declarative workflows with R presented the R-package {drake} (drake = Data Frames in R for Make7).
{Drake} was created by Will Landau and reviewed by rOpenSci. On the github page it says that {drake} is a “general-purpose workflow manager for data-driven tasks”. Sounds perfect!
The way I understand it is, that it is based on make (and overlaps with the R-package {remake}). Therefore when making a change to an analysis and re-running it, it only re-compute the dependent parts. But compared to make, {drake} is much more convenient to use. Plus it is scalable to parallel computing. And it is intuitive to use, meaning, colleagues can learn it quickly.
Getting started
Best is, to run the mini example provided in the package, and then go from there. Drake has many other examples provided; you can check them by running drake::drake_examples().
install.packages("drake")- Run
drake::drake_example("main")→ this will download a folder calledmain. - Go to the terminal. You can look at all the files contained in
mainby writingtree main(this works on MacOS)
main/
├── COPYRIGHT.md
├── LICENSE.md
├── README.md
├── clean.R
├── make.R
├── raw_data.xlsx
└── report.Rmd- Next, open
make.R. The key functions aredrake_plan()andmake(). - Add the following bit before and after
make(plan).
config <- drake_config(plan)
vis_drake_graph(config) - Run all code for a first time.
- Change something (e.g. the plot function).
- Rerun and watch the colours change in
vis_drake_graph(config). - Use functions
readd()andloadd()to work with the produced output. - checkout
.drake/folder. This is where all the cached work is stored.
By running this example, you will see that drake_plan() is used to create a recipe of the analysis and make() is used to execute that recipe. make() will create objects, such as fit and hist in the example and store them in the folder .drake/.
readd() is used to return an object from cache. This is handy when we only want to display an object. loadd() on the other hand is used to load an object into our session (similarly to load).
More
To further checkout options I recommend - The slides from Christine Stawitz (presented at R-Ladies Seattle in June 2018). - The material by Amanda Dobbyn (presented at R-Ladies NYC in February 2019). (Update)
Both presentations provide a good overview of the options {drake} provides.
Examples
I also created some tiny examples that use genetic data. It has four folders:
wild-west: this is how I was structuring folders till now (this example was used to introduce the analysis during the presentation).wild-west-pro: same as 1. but with anREADME.md.drake: implementing 1. into drake.drake-adv: implementing 1. into a more realistic, hierarchical folder structure.
The examples use genetic data that was originally used in the crowdAI openSNP height prediction challenge. The full openSNP data set was prepared by my colleague Olivier Naret and can be downloaded here. The examples use a small subset of the entire dataset that can be downloaded here.
Resources
Here are a bunch of resources that helped me understand {drake}:
- Github Repo
- This tutorial and cheatsheet by Kirill Müller.
- Overview of options: Make-like declarative workflows with R by Christine Stawitz.
- Best practices for drake projects.
- Lots of tutorials and examples.
But wait: drake does not care about messy folders
True! I can have a make.R file anywhere and it will still work.
But I believe that the shift in logic that you have to get used to with {drake} makes you care more about folder structure.
What is next?
I am currently reading the PlosCompBio paper Good enough practices in scientific computing - a great read, giving me lots of ideas!
I want to use {drake} in a more complex setting. There are also other R-packages that help with project workflows. And I should invest some time to come up with a test suite for data analysis projects.
When is the right time to tidy
At the Genève RUG meetup, we were also discussing when we think is the right time to tidy up.
Project folders evolve. Especially at the beginning of a project, we are busy figuring things out, wrangling data, fitting models, making plots and telling people what we found out. This can take some time. But at one point we are ready to write a report.
It is probably at that stage (when we write a report) that we can “frame” that project into something that is “stable” and “portable”.
Although - I am not sure we have to wait that long. I think the benefits of {drake} (e.g. caching) already help us at an earlier stage.
Is it worth it?
I think there is a trade-off between dedicating days to tidying up and not caring about structure at all. Same with tooling. For example, if we use a tool, say make, but no one else but us knows how to use it, it is going to be hard for colleagues to understand and use project folders that use make. We have to keep that balance in mind.
Seriously, meaning, different from previous, half-hearted attempts.↩
Just started reading Good enough practices in scientific computing - great paper!↩
Thanks to Maëlle for pointing out that this is a good thing to do!↩
And while at it, I would totally decrease my coffee consumption too and never procrastinate again 😉.↩
The terminology is really confusing at times. I rely on this definition. ↩
Thanks to my colleague for the idea!↩
I am still wondering how “Data Frames in R for Make” adds up to “drake” 🤔.↩
)