This post provides the R-Code to map the 26 populations of the 1000 Genomes project.
Goal
Create a map similar to the one1 on the front page of http://www.internationalgenome.org/ in a reproducible manner.
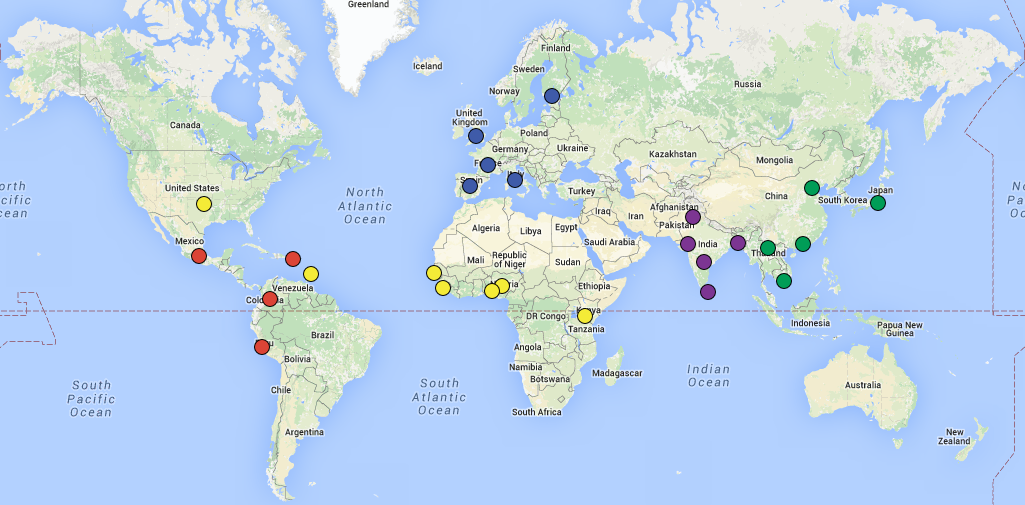
Version on internationalgenome.org
Get started
Packages needed:
## accessed via ::
# library(mapview)
# library(readxl)
# library(readr)
# library(purrr)
# library(tidyr)
# library(forcats)

library(leaflet)
library(dplyr)
library(ggmap) ## for geocode, devtools::install_github("dkahle/ggmap")
ggmap requires a google map api key2:
- get one here: https://developers.google.com/maps/documentation/geocoding/get-api-key
- then run
register_google(key = "my_api_key")
Data
- The population counts and labels are from ftp.1000genomes.ebi.ac.uk/vol1/ftp/technical/working/20130606_sample_info/ (download xlsx file).
- The super population labels are from here (pasted into a csv, then the location was inferred).
Download the population counts and labels first:
url <-
"ftp.1000genomes.ebi.ac.uk/vol1/ftp/technical/working/20130606_sample_info/20130606_sample_info.xlsx"
url.bitly <- "http://bit.ly/2MQTr02"
download.file(url, "20130606_sample_info.xlsx", mode = "wb")
Import file into R:
df <-
  readxl::read_excel("20130606_sample_info.xlsx", sheet = "Sample Info")
  #  >> Sample Info
Some data wrangling:
## count number of individuals by population
## rename population > POP
n.pop <-
  df %>%
  group_by(Population) %>%
  summarise(n = n()) %>%
  rename(POP = Population)

## import super population names and details to the location of populations
## copied from here:
url.spop <-
  "http://www.internationalgenome.org/faq/which-populations-are-part-your-study/"
## added location manually (!) - found this the only option to prevent overlapping locations.
## Also, description involves a mix of location and origin.

## rename superpopulation > SPOP
n.spop <-
  readr::read_csv("../../static/post/2018-12-05-1000genomes-map/sample_info_superpop.csv") %>%
  rename(POP = `Population Code`, SPOP = `Super Population Code`)

## join the two information
n.1kg <- left_join(n.pop, n.spop, by = c("POP" = "POP"))
Add geographical coordinates
Parts of the code below is from a map created by Daniela Vazquez for R-Ladies: https://github.com/rladies/Map-RLadies-Growing.
This is the part where we annotate the dataframe n.1kg with where the individuals live (not their ancestry).
Repeat this until there are no warnings() about QUERY LIMITS (the while loop takes care of this).
We will use the ggmap package, which accesses the google maps api.
A workaround is to set source = "dsk" (works for a limited number of queries)3.
n.1kg <- n.1kg %>%
  mutate(purrr::map(.$location, geocode, source = "dsk")) %>%
  tidyr::unnest()

## running into the inevitable QUERY LIMITS problems, lets use the approach from https://github.com/rladies/Map-RLadies-Growing
n.1kg.withloc <- n.1kg %>%
  filter(!is.na(lon))

while(nrow(n.1kg.withloc) != nrow(n.1kg))
{
  #   repeat this until there are no warnings() about QUERY LIMITS
  temp <- n.1kg %>%
    select(-lon, -lat) %>%
    anti_join(n.1kg.withloc %>% select(-lon, -lat)) %>%
    mutate(longlat = purrr::map(.$location, geocode, source = "dsk")) %>%
    tidyr::unnest() %>%
    filter(!is.na(lon))

  n.1kg.withloc <- n.1kg.withloc %>%
    bind_rows(temp) %>%
    distinct()
}

n.1kg <- n.1kg.withloc

## glue POP and `Population Description` together
n.1kg <-
  n.1kg %>% mutate(pop.desc = paste0(POP, " : ", `Population Description`, " (", SPOP, ")"))

## given that only a number of geolocation are possible with the google API, this
## should probably stored out
## readr::write_csv(n.1kg, path = "1kg_sample_info_location.csv")
Create leaflet
Map locations a world map with leaflet
## if you have stroed the data in the previous chunk:
## readr::read_csv("1kg_sample_info_location.csv")
Define shiny icons:
icons <- awesomeIcons(
  icon = 'user', #people',
  iconColor = 'black',
  library = 'fa', #ion
  markerColor = as.character(forcats::fct_recode(as.factor(n.1kg$SPOP),
                                                 red = "EUR",
                                                 blue = "AFR",
                                                 green = "AMR",
                                                 gray = "EAS",
                                                 orange = "SAS"))
  ## ok, thats not too pretty, but turns out, hex colors won't work
)

## we need to create a vector that maps cols to SPOP from the markerColor argument above
cols <- c("#E50102", "#00A9DD", "#57BA1F", "#575757", "#FD8E00")
SPOP <- c("EUR",  "AFR", "AMR", "EAS", "SAS")

## separate icon that will display the information
## ------------------------------------------------
icon.info <- awesomeIcons(
  icon = 'info', #people',
  iconColor = 'white',
  library = 'fa', #ion
  markerColor = "white"
)
Create map:
m <- leaflet(data = n.1kg) %>%
  addTiles() %>%  # Add default OpenStreetMap map tiles
  addAwesomeMarkers(lat=~lat, lng=~lon, label = ~htmltools::htmlEscape(pop.desc), icon = icons) %>%
  addAwesomeMarkers(lat=-45, lng=-107, popup = glue::glue("Source: https://github.com/sinarueeger/map-1000genomes"), icon = icon.info) %>% ## this bit has potential to be displayed as a href.
  #glue::glue("Source: {url.bitly} + {url.spop} (manual tidying)"), icon = icon.info) %>%
  addLegend("bottomright",
            colors =cols,
            labels= SPOP,
            opacity = 1)

m  # Print the map
Save the map
## save to png
## ------------
mapview::mapshot(m, file = "map-1000genomes-populations.png")

## save to hmtl
## -------------
htmlwidgets::saveWidget(m, file="map-1000genomes-populations.html")
Reason for deviation from the original
I mapped the populations according to the current location but coloured them according to ancestry.
This is a png and cannot be altered.↩
Seen here: https://stackoverflow.com/questions/36175529/getting-over-query-limit-after-one-request-with-geocode.↩
See https://stackoverflow.com/questions/36175529/getting-over-query-limit-after-one-request-with-geocode.↩
)